Whether you are a part of a public or private institution in European Union you definitely heard about “European funds”. We will do our best not to bother you with the various names of available funding schemes, not here anyway, so to put it simply enough (barbaric – some may criticize) to suit our reasoning, we divided them into categories: A) innovation grants and B) “the others” (we warned you it is unsophisticated). Both are provisioned in the Multiannual Financial Frameworks (MFF) which are long negotiated and approved (and that is another tale).
Commonly, in “the others” category we find projects that we are most accustomed to and which, in short, deliver results, actually tangible and positive results. For example, it is about purchasing equipment, developing a software or an application, starting a business with X number of employees, building an infrastructure (highways, bridges) and so on.
So, the good news here is that all member states (MS) have already created an infrastructure which is (somewhat) scalable to absorb this category of funds. It goes without saying that everyone, political level included, is willing to showcase these tangible results.
With innovation, well that’s a different story!
As Trump would say: billions and billions and billions!
We said that innovation is the new gold rush.
Take a look at the trends below (note that the sums in the charts are expressed in billions of €).
#1 Innovation!
The funds were called Framework Programme – FP – between 1984 and 2014 and Horizon – H – between 2014 and 2027.
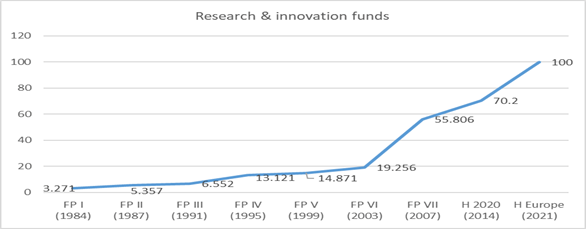
Notice how the budget jumps during the EU enlargement timeframes:
- it more than doubled in 1995 when the 4th EU enlargement came into play (FP IV)
- it also increased by 25% one year prior to the largest enlargement so far on the 1st of May 2004 when 10 new countries joined the EU (FP IV)
- it triples in 2007, the year when Romania and Bulgaria joined (FP VII)
- it increases around 35% one year after Croatia joined EU in 2014 (H2020)
You might think it is normal to experience this ascending trend with every enlargement, since more countries = more cash. Right?
If so, why Brexit means an additional 30 billion in Horizon Europe?
Is there a new rule coming in: less countries = more cash?
#2 The others!
We have decided to show only data from 2000 until 2014 because the priorities which receive funding have various names across MFFs and we would end up lost in translation. We did not include the estimation for 2021 – 2027 since there much negotiation on COVID recovery plan which is part of a 3 pillar programme named Next Generation EU.
Consequently, to make our point we picked up on regional and cohesion funds because they are the largest.
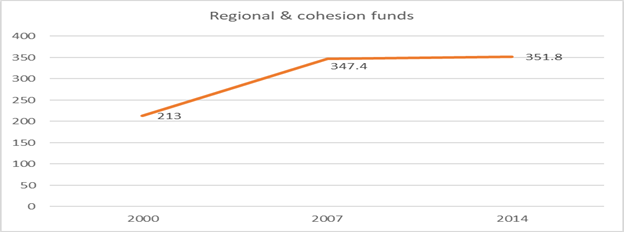
Interesting pattern, right?
So, we depict the same ascending trend, again influenced by enlargement policies, but not quite the same multiplication factor!
Now, why is that?
More precise, why innovation funds grew 4.7 times from 1999 until 2014 and the regional and cohesion multiplied only by 1.65 from 2000 until 2014?
Would the politically correct answer be: we are in the middle of a paradigm shift?
The paradigm shift
We are already one week into the German Presidency of the Council of the EU and innovation & digitalization are recurrent words in all strategy papers and speeches.
Just 3 examples:
- the joint virtual press conference held on the 2nd of July 2020 by Chancellor Angela Merkel and the President of the European Commission Ursula von der Leyen, the latter said “the economic bailout package must be used creatively to bolster the EU’s climate change response, improve its digitalization and modernize the single market”. More here: https://www.dw.com/en/germany-takes-helm-of-eu-presidency-merkel-urges-resolve-on-virus-recovery-plan/a-54028882
- the presidency programme which focuses on six main areas and number two is … “a stronger and more innovative Europe”. More here: https://www.consilium.europa.eu/en/council-eu/presidency-council-eu/
- while preparing the 2021 budget the European Commission in Statement of estimates of the European Commission for the financial year 2021, issued in June 2020,in section 3 Key aspects of the 2021 draft budget by financial headings, ranks at heading 1 – Single market, innovation and digital. In terms of budgets, heading 1 ranks at #3 with 44.3 billion, right after Cohesion and values (225.5 billion) and Natural Resources and Environment (66.3 billion). More here (page 6 and page 17): https://ec.europa.eu/info/sites/info/files/about_the_european_commission/eu_budget/2020-06-24_12h30_-_soe2021_-_full_-_v2_0.pdf
Actually, the Statement of estimates document uses very concrete terms which touch the ground of innovation:
- “a Europe fit for digital age” is #2 in the six political priorities of the EU Commission (page 7, para 1.2)
- “the path out of the crisis will be built in the Sustainable Development Goals and shall support the twin green and digital transition” (page 8 para 1.2)
- “The Commission will focus on three key objectives to ensure that digital solutions help Europe to pursue its own way towards a digital transformation that works for the benefit of citizens: technology that works for people; a fair and competitive economy; and an open, democratic and sustainable society.” (page 10 para 1.2.3)
Thereupon, if we are in the middle of the paradigm shift to innovation and mainly digital, are MSs ready to jump in synchronization with the multiplier factor of these funds?
Are the mechanisms created by MSs to manage the 1.65 multiplication factor of “the others” funds ready to cope with a 4.7 factor or better yet a walloping 6.72 multiplication if we take into consideration the omnipresent 100 billion € estimation for Horizon Europe (in comparison to 14.871 billion of FP V in 1999)?
Let’s scrutinize the top performers and learn a trick or two!
All aboard or who’s on board?
So, who are the medalists?
Who gets all the brownie points?
Well, pay attention to the (self-explanatory) charts below.
#1 Where does “magic’ happen?
a). Top countries which benefited from FP VII funds: De., Uk., Fr., It., Nl., Es.
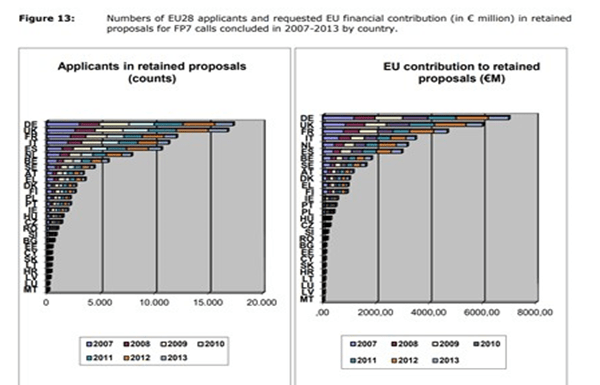
b). Top countries in H2020 compared to FP VII: Uk., De., Es., It., Fr., Nl.
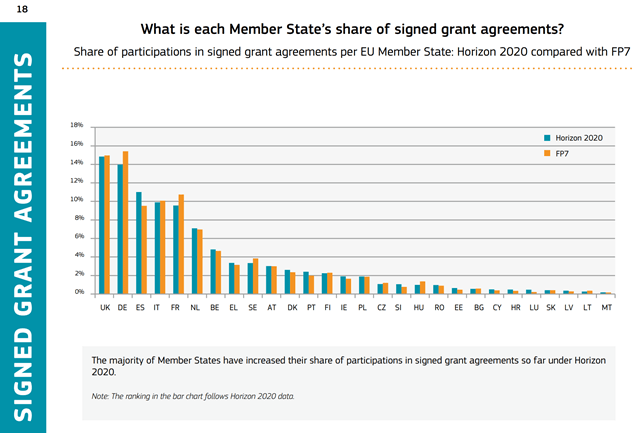
Source: (page 18) https://www.ffg.at/sites/default/files/horizon_2020_first_results_1.pdf
#2 Who does “magic”?
What types of organizations in MSs are willing and capable of absorbing innovation funds?
a). in FP VII the exact order is: 1st Higher or secondary education (HES), 2nd Private for profit (excluding education) (PRC), 3rd Research organisations (REC), 4th Other (OTH) and 5th Public body (excluding research and education) (PUB)

b). top organizations in Horizon compared to FP VII: 1st Higher or secondary education (HES), 2nd Private for profit (excluding education) (PRC), 3rd Research organisations (REC), 4th Public body (excluding research and education) (PUB) and 5th Other (OTH)
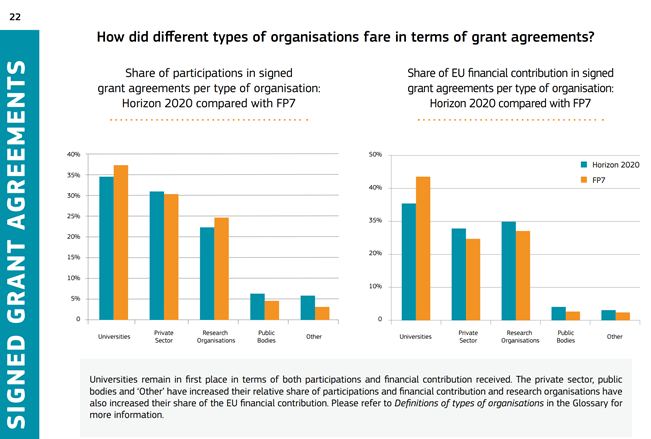
Source: (page 22) https://www.ffg.at/sites/default/files/horizon_2020_first_results_1.pdf
Notice how the 2 sources (#1 & #2) contradict one another when it comes to the last and second to last places occupied by types of organizations.
This is why EU funding is still a maze for a significant number of citizens, private and public institutions alike!
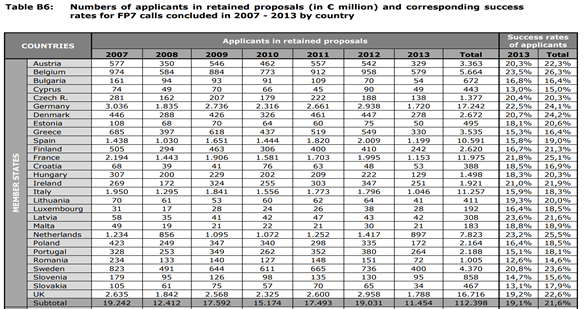
#3 How does “magic” occur?
Innovation funds is both a volume model and a trial and error process.
Observe the table below:
Takeaways
#1 Patterns
There are a few patterns of the top performers:
- Strategy – prepare in advance: notice the high number of proposals submitted in the very first year of implementation of FP VII in 2007 (i.e. De., Uk., Fr., It., Nl)
- Consistency – every year they prepare and submit projects for calls of proposals,
- Success rate – top MSs write 5 or 4 projects to win 1 contract in comparison to others which need to prepare 7 proposals to end up with 1 success
- Volume – it is a natural consequence of understanding success rate: the more proposals an MS submits, the better chances of being awarded a contract.
#2 Joining the Gold Rush
Unless you are in a quest for developing a disruptive scenario, history points out that the necessary (not sufficient) instruments for joining the innovation funding stream are:
- Capacity building:
- Develop higher or secondary education institutions. Beside teaching, new research and innovation and research and development areas need setting up. It should be one of the KPIs of the CEO
- Encourage private for-profit companies to respond to calls of proposals
- Design national programmes to promote and financially assist the two main categories of beneficiaries of innovation funds: education institutions and private for-profit companies
- Create national hubs in various areas of interest for a particular MS focused on creating and sustaining synergies among different beneficiaries
- Process design:
- Build networks of partnerships with eligible institutions from other MSs since all calls of proposals issued by the Commission require projects which have beneficiaries from at least 2 MSs (with a record of 16 MSs!)
- Apply open government policies so that relevant data (the necessary information to explain the need for intervention by proposing a project) is available for all the categories of potential beneficiaries
- Implement feedback loops and forums where beneficiaries can exchange failures and success stories
3. Product design … well this right up your creativity alley!
