Quantitative data on COVID 19 is wrong! Globally!

The simple 2 gut reactions of readers might be:

  1. Buuuuuh! Yeah, right!
  2. I knew it was a conspiracy!

We kindly and gently ask you to keep your sense and thinking open.

Quantitative data is (more) relevant (now)!

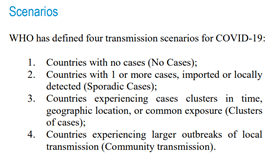
During the first months of 2020 the quantitative data (reported cases) were relevant for implementing appropriate measures to counter the spread of the virus. Remember the World Health Organization (WHO) has drafted 4 transmissions scenarios for COVID 19 (WHO – Interim Guidance issued on 22nd of March 2020) which were a mix between cases and clusters (without really defining them).

Based on those scenarios, most countries ended up in total lockdowns.

Consequently, one rule applied for everyone!

Once economic reasoning started to surface, from total lockdowns we find ourselves in various intervention loops which affect some of us. If the number, actually the cases or clusters, of COVID 19 infections rise in your community it may turn your world up side down.

As a result, quantity matters more now! It has direct consequences on policies, actions, and measures which, in practice, result in:

  1. permission to enter or exist a country
  2. affecting the family budget – you need to pay for tests if you need to travel to a country or area for work or holiday,
  3. possibility to work – one cannot work if he or she has to stay in isolation for X number of days after travelling to one country for vacation or business
  4. unemployment – if the area where you live is in quarantine and your workplace is somewhere else, you do not get paid or even lose the job
  5. budget allocation for a country from EU or the Federal Government in US

So, from one rule for all we have more rules for some!

Isn’t that a recipe for social inequality even only at perception level and isn’t this a recipe for social disorder?

We have shown quantity, a number, matters greatly both for individuals and countries. Therefore, we should treat data (number) collection with gigantic attention!

Well, are we?

Another example

To get away from the heat of the action and hopefully use more reasoning, to answer this question we propose you take the time and study a scenario for a completely different problem.

Say you want to know how many new cars are rubbing against the fresh laid down asphalt in your country.

Where do you get your data?

 The (possible) solutionThe critics
 1.I would ask all the car manufactures how many new cars they sold in my country  If the cars are still at the car dealer’s shop, they are not rubbing against the asphalt!
 2.I would ask the car dealers in my country how many new cars they have sold  If I bought a car from another country, you would not count me in!
 3.I would ask the office for car registration how many new cars have been registered  If I am living in another country and came to your country for holidays I would not be in that statistics!
 4.I would install pressure sensors on all the roads and find out how many cars are passing by  If I drive 3 times in the same street you would count 3 cars so you will not have the exact number of cars!
 5.I would also install license plate recognition cameras and software and I will remove all the duplicates  If I change the license plate number on my car you would count 2 cars and your answer will not be accurate
 6.I will ask other countries how they do it (what is the methodology) or I will search the internet for solutions  Some will answer but they will not match 100% the administrative business flows in your country
7. I am fed up with people who always say it is not possible!  I am a business analyst, ask a statistician![1]

[1] More on differences here: https://www.northeastern.edu/graduate/blog/data-analyst-vs-business-analyst/

It seemed the question was clear and the answer not particularly hard to get.

By instinct and experience alone anyone could say if there are more or less cars but putting our finger on one exact number (not cases or clusters) … not so easy.

And numbers matter! Greatly!

Stop and smell the roses

One fallacy of performance evaluation states that a manager tends to be influenced by the latest work of an employee and overlooks some old achievements or mistakes which still occurred during the same assessment period.

What if humanity is caught up in the latest achievements and overlooks the entire business process?

Are we so into artificial intelligence, quantum computing, predictions, machine learning, deep learning, generating models, patterns, trends, forecasting, heat maps, bubble maps, and dashboards that we do not care about the source of data?

Why do we overlook the origin of data?

Here are some plausible answers:

  1. Countries must do their best, taking into consideration the pandemic so their numbers are correct
  2. It is easy to report how many COVID 19 cases are in one country, there has to be a system in place
  3. It must be a worldwide methodology on how and what to report
  4. Everyone has the same definition of COVID 19 reporting terms like: “cases”, “new cases”, “clusters”, “death related to COVID 19”, etc.
  5. Data is coming in constant flows so, clearly, there is a mechanism in place
  6. There are (almost) no signs that data is wrong so why question

Patient zero: data (numbers)

No methodology!

No IT systems or apps!

No database models!

Exactly! There is no public data on:

  1. Methodologies or procedures about how to count and report COVID 19 numbers, individuals, cases or clusters!
  2. IT systems existing or presented as best practice (or even implemented or tested) to assist COVID 19 case reporting! So, Mr. Jobs “there is NO app for that”!
  3. Data models (the ways information is organized in an application / a software programme) about how it might be better to design, develop and manage the workflows, stakeholders and so on in electronic environment did not surfaced!

Yet, we have dashboards and maps and charts!

Yet, we use all these to describe, interpret, evaluate, analyze, predict, and estimate!

Yet, (finally) we package everything as bedrocks for our measures and actions, thus justifying (all) the consequences!

Where do numbers come from and what do they really mean?

Cases not numbers! Touche!

Nice and elegant touch! Sadly, it brings up (again) more questions than answers.

Why use cases instead of number of persons which are infected with COVID 19?

Does this mean that we can experience scenarios when “a person = more cases” OR “more cases = one person”?

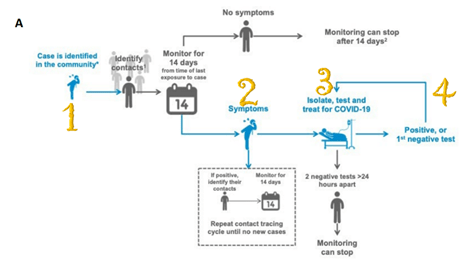
If “persons ≠ cases” it means that when you set a quarantine in a neighborhood because of increase in cases you cannot touch, literally, put your finger on ALL the cases because they are not equal to persons.

We might depict what is the definition of a case if we use interpretative analysis (which humans are good at these times) on chart below:

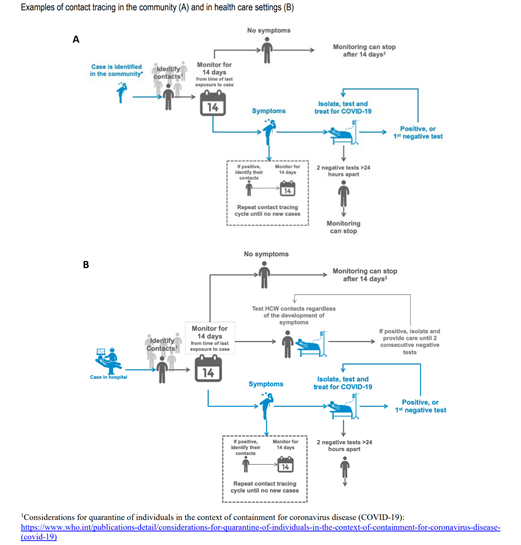
The chart can be found at page 3 of this document:

1 = 1 or 1 = more?

There is our answer! The word “case” is written in blue:

  • example A “case is identified in the community”
  • example B “case in hospital”

Mystery solved!

If we show the chart to a business analyst, he or she will come up with the following:

  1. Aha! The case is a process
  2. I can report a process as 1 (clearly it has a beginning and an end) so 1 = 1
  3. I can report each stage of the process, so 1 = 4
  4. I can report the stages and the iterations of the process (since step 4 happens with every repeating test), so 1 > 4

This is how the chart will be amended:

And with so many possible answers (just like in the car and asphalt example), the world wide dashboards simply display one number! Ups, we apologize, they show a number of cases!

And the rest will just follow the same line:

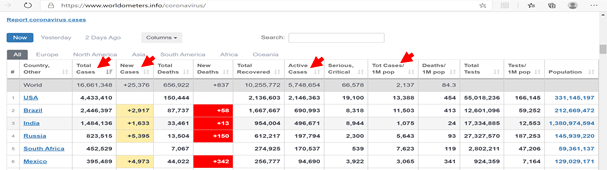
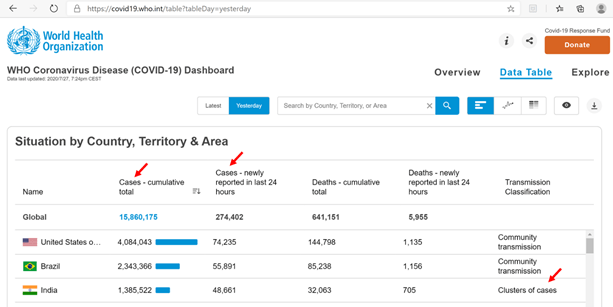
One last thing, what are “cases – newly reported” (shown in the table of WHO) or “new cases” (shown in the second table of worldometers)?

It could be a new case in stage 1, it also might be the positive result of a retesting performed during the iterative process (stage 4). It is an important distinction to know if “new cases” represent:

  • X number of persons which have been infected in the last 24 hours
  • OR
  • X number of persons who have the virus in the last 24 hours even though they were infected 2 days before
  • OR
  • X number of persons who have tested positive in the last 24 hours maybe for the first time or +1 time

Wishful thinking

  1. The norms or the methods used for collecting data about COVID 19 should exist in all countries
  2. They should also be transparent, readable and understandable: simple charts, logic representations
  3. With all the IT&C savvies in the world and with unlimited capacity for crowd sourcing we should design, develop and publish a data model, an open source code, an app which might assist data collection throughout a transparent process from bottom (individual) to the top (Governments r WHO)
  4. The need to understand data using critical thinking should be as important for individuals, media and influencers as presenting trends and predictions
  5. A molecular part of the enormous budgets showcased in USA or EU to fight the impact of COVID 19 should finance the understanding of the reporting process

New Gold Rush: Innovation EU funding

Whether you are a part of a public or private institution in European Union you definitely heard about “European funds”. We will do our best not to bother you with the various names of available funding schemes, not here anyway, so to put it simply enough (barbaric – some may criticize) to suit our reasoning, we divided them into categories: A) innovation grants and B) “the others” (we warned you it is unsophisticated). Both are provisioned in the Multiannual Financial Frameworks (MFF) which are long negotiated and approved (and that is another tale).

Commonly, in “the others” category we find projects that we are most accustomed to and which, in short, deliver results, actually tangible and positive results. For example, it is about purchasing equipment, developing a software or an application, starting a business with X number of employees, building an infrastructure (highways, bridges) and so on.

So, the good news here is that all member states (MS) have already created an infrastructure which is (somewhat) scalable to absorb this category of funds. It goes without saying that everyone, political level included, is willing to showcase these tangible results.

With innovation, well that’s a different story!

As Trump would say: billions and billions and billions!

We said that innovation is the new gold rush.

Take a look at the trends below (note that the sums in the charts are expressed in billions of €).

#1 Innovation!

The funds were called Framework Programme – FP – between 1984 and 2014 and Horizon – H – between 2014 and 2027.

Notice how the budget jumps during the EU enlargement timeframes:

  • it more than doubled in 1995 when the 4th EU enlargement came into play (FP IV)
  • it also increased by 25% one year prior to the largest enlargement so far on the 1st of May 2004 when 10 new countries joined the EU (FP IV)
  • it triples in 2007, the year when Romania and Bulgaria joined (FP VII)
  • it increases around 35% one year after Croatia joined EU in 2014 (H2020)

You might think it is normal to experience this ascending trend with every enlargement, since more countries = more cash. Right?

If so, why Brexit means an additional 30 billion in Horizon Europe?

Is there a new rule coming in: less countries = more cash?

#2 The others!

We have decided to show only data from 2000 until 2014 because the priorities which receive funding have various names across MFFs and we would end up lost in translation. We did not include the estimation for 2021 – 2027 since there much negotiation on COVID recovery plan which is part of a 3 pillar programme named Next Generation EU.

Consequently, to make our point we picked up on regional and cohesion funds because they are the largest.

Interesting pattern, right?

So, we depict the same ascending trend, again influenced by enlargement policies, but not quite the same multiplication factor!

Now, why is that?

More precise, why innovation funds grew 4.7 times from 1999 until 2014 and the regional and cohesion multiplied only by 1.65 from 2000 until 2014?

Would the politically correct answer be: we are in the middle of a paradigm shift?

The paradigm shift

We are already one week into the German Presidency of the Council of the EU and innovation & digitalization are recurrent words in all strategy papers and speeches.

Just 3 examples:

  1. the joint virtual press conference held on the 2nd of July 2020 by Chancellor Angela Merkel and the President of the European Commission Ursula von der Leyen, the latter said “the economic bailout package must be used creatively to bolster the EU’s climate change response, improve its digitalization and modernize the single market”. More here: https://www.dw.com/en/germany-takes-helm-of-eu-presidency-merkel-urges-resolve-on-virus-recovery-plan/a-54028882
  2. the presidency programme which focuses on six main areas and number two is … “a stronger and more innovative Europe”. More here: https://www.consilium.europa.eu/en/council-eu/presidency-council-eu/
  3. while preparing the 2021 budget the European Commission in Statement of estimates of the European Commission for the financial year 2021, issued in June 2020,in section 3 Key aspects of the 2021 draft budget by financial headings, ranks at heading 1 – Single market, innovation and digital. In terms of budgets, heading 1 ranks at #3 with 44.3 billion, right after Cohesion and values (225.5 billion) and Natural Resources and Environment (66.3 billion). More here (page 6 and page 17): https://ec.europa.eu/info/sites/info/files/about_the_european_commission/eu_budget/2020-06-24_12h30_-_soe2021_-_full_-_v2_0.pdf

Actually, the Statement of estimates document uses very concrete terms which touch the ground of innovation:

  • “a Europe fit for digital age” is #2 in the six political priorities of the EU Commission (page 7, para 1.2)
  • “the path out of the crisis will be built in the Sustainable Development Goals and shall support the twin green and digital transition” (page 8 para 1.2)
  • “The Commission will focus on three key objectives to ensure that digital solutions help Europe to pursue its own way towards a digital transformation that works for the benefit of citizens: technology that works for people; a fair and competitive economy; and an open, democratic and sustainable society.” (page 10 para 1.2.3)

Thereupon, if we are in the middle of the paradigm shift to innovation and mainly digital, are MSs ready to jump in synchronization with the multiplier factor of these funds?

Are the mechanisms created by MSs to manage the 1.65 multiplication factor of “the others” funds ready to cope with a 4.7 factor or better yet a walloping 6.72 multiplication if we take into consideration the omnipresent 100 billion € estimation for Horizon Europe (in comparison to 14.871 billion of FP V in 1999)?

Let’s scrutinize the top performers and learn a trick or two!

All aboard or who’s on board?

So, who are the medalists?

Who gets all the brownie points?

Well, pay attention to the (self-explanatory) charts below.

#1 Where does “magic’ happen?

a). Top countries which benefited from FP VII funds: De., Uk., Fr., It., Nl., Es.

Source: (page 21) https://wayback.archive-it.org/12090/20191229115753/http://ec.europa.eu/research/evaluations/pdf/archive/fp7_monitoring_reports/7th_fp7_monitoring_report.pdf#view=fit&pagemode=none

b). Top countries in H2020 compared to FP VII: Uk., De., Es., It., Fr., Nl.

Source: (page 18) https://www.ffg.at/sites/default/files/horizon_2020_first_results_1.pdf

#2 Who does “magic”?

What types of organizations in MSs are willing and capable of absorbing innovation funds?

a). in FP VII the exact order is: 1st Higher or secondary education (HES), 2nd Private for profit (excluding education) (PRC), 3rd Research organisations (REC), 4th Other (OTH) and 5th Public body (excluding research and education) (PUB)

Source: (page 14) https://wayback.archive-it.org/12090/20191229115753/http:/ec.europa.eu/research/evaluations/pdf/archive/fp7_monitoring_reports/7th_fp7_monitoring_report.pdf#view=fit&pagemode=none

b). top organizations in Horizon compared to FP VII: 1st Higher or secondary education (HES), 2nd Private for profit (excluding education) (PRC), 3rd Research organisations (REC), 4th Public body (excluding research and education) (PUB) and 5th Other (OTH)

Source: (page 22) https://www.ffg.at/sites/default/files/horizon_2020_first_results_1.pdf

Notice how the 2 sources (#1 & #2) contradict one another when it comes to the last and second to last places occupied by types of organizations.

This is why EU funding is still a maze for a significant number of citizens, private and public institutions alike!

#3 How does “magic” occur?

Innovation funds is both a volume model and a trial and error process.

Observe the table below:

Source: (page 99) https://wayback.archive-it.org/12090/20191229115753/http://ec.europa.eu/research/evaluations/pdf/archive/fp7_monitoring_reports/7th_fp7_monitoring_report.pdf#view=fit&pagemode=none

Takeaways

#1 Patterns

There are a few patterns of the top performers:

  1. Strategy – prepare in advance: notice the high number of proposals submitted in the very first year of implementation of FP VII in 2007 (i.e. De., Uk., Fr., It., Nl)
  2. Consistency – every year they prepare and submit projects for calls of proposals,
  3. Success rate – top MSs write 5 or 4 projects to win 1 contract in comparison to others which need to prepare 7 proposals to end up with 1 success
  4. Volume – it is a natural consequence of understanding success rate: the more proposals an MS submits, the better chances of being awarded a contract.

#2 Joining the Gold Rush

Unless you are in a quest for developing a disruptive scenario, history points out that the necessary (not sufficient) instruments for joining the innovation funding stream are:

  1. Capacity building:
    • Develop higher or secondary education institutions. Beside teaching, new research and innovation and research and development areas need setting up. It should be one of the KPIs of the CEO
    • Encourage private for-profit companies to respond to calls of proposals
    • Design national programmes to promote and financially assist the two main categories of beneficiaries of innovation funds: education institutions and private for-profit companies
    • Create national hubs in various areas of interest for a particular MS focused on creating and sustaining synergies among different beneficiaries
  2. Process design:
    • Build networks of partnerships with eligible institutions from other MSs since all calls of proposals issued by the Commission require projects which have beneficiaries from at least 2 MSs (with a record of 16 MSs!)
    • Apply open government policies so that relevant data (the necessary information to explain the need for intervention by proposing a project) is available for all the categories of potential beneficiaries
    • Implement feedback loops and forums where beneficiaries can exchange failures and success stories

3. Product design … well this right up your creativity alley!

Set your browser to .de and .fr

Your implicit was to browse across the Channel or the ocean to have a sense on what was coming your way either to improve yourself of develop your business.

If you want to jump not crawl, it just might be that the next plausible future for you are strategic decisions and trends arising from Germany and France.

Think of the following timeline:

  1. We are one day away from the official launch (1st of July 2020) of the German Presidency to the Council of the European Union. Keep an eye on: https://www.bundesregierung.de/
  2. For 6 months, all groups, networks and meetings of the Council will be chaired by German officials.
  3. Germany will be part of the information and strategic loop until 31st of December 2021 since it will lead the Trio Presidency (taking over from the Trio ran by Romania) which will also include Portugal and Slovenia. See more here: https://www.consilium.europa.eu/ro/documents-publications/library/library-blog/posts/the-presidency-of-the-council-of-the-eu/
  4. On the 1st of January 2022 Germany hands over the Trio to … drums & bells … exactly: France! The French will partner up with the Czech Republic and Sweden.
  5. The mandate of the Trio led by France will end on the 30st of June 2023.
  6. Yesterday (29.06.2020) Angela Merkel and Emmanuel Macron had met at Meseberg Castle. the 2 Trios working together! See more here: https://www.france24.com/en/20200629-live-macron-and-merkel-push-covid-19-recovery-fund-as-germany-takes-on-eu-presidency
  7. Bring on 3 amazing years starting tomorrow!

Think of the following opportunities:

  1. Angela Merkel already said in 2018 that she will not run for a new mandate in 2021.
  2. So, if you were in her shoes would you ‘let a good crises go to waste’ or would you take a shot at ranking among the top in history books? She can pick any topic, there are plenty hot ones on the table:
    • Covid 19
    • New economic crises (already compared by some with the one at the end of WW2)
    • Brexit
    • Multiannual Financial Framework 2021-2027
    • Digitalization (emerging after work from home solutions had been implemented)
  3. Lets’ move to France. The next Presidential elections are planed for April – May 2022, just in the midst of the French Presidency of the Council. How convenient if played right!
  4. Starting with November last, President Macron already targeted humongous topics like:

Why sensenthink?

The social fallacy: panem et circenses

… Already long ago, from when we sold our vote to no man, the People have abdicated our duties; for the People who once upon a time handed out military command, high civil office, legions — everything, now restrains itself and anxiously hopes for just two things: bread and circuses.

Juvenal, Satire 10.77–81

The change actor: synthesisers

Such an education (n. Odyssean education) and training might develop synthesisers who have 1) a crude but useful grasp of connections between the biggest challenges based on trans-disciplinary thinking about complex systems; 2) a cool Thucydidean courage to face reality including their own errors and motives; 3) the ability to take better decisions and adapt fast to failures; 4) an evolutionary perspective on complex systems and institutional design (rather than the typical Cartesian ‘chief of the tribe’ perspective); and 5) an ability to shape new institutions operating like an immune system that will bring better chances to avoid, survive, and limit damage done by inevitable disasters.

Some thoughts on education and political priorities, Dominic Cummings

The method: causal layered analysis

Causal layered analysis is based on the assumption that the way in which one frames a problem changes the policy solution and the actors responsible for creating transformation.

Causal layered analysis, Sohail Inayatullah

Our mission is to volunteer a insight on challenges by moving away from panem et circenses, appeal to synthesisers and proposing a method for the creation of alternative futures.

Our take is to keep our posts as slim and tight as possible not only to compete for the attention span of all social media generations but also to leave room for causatum.

Rating: 1 out of 5.

Rate us

Why (sensenthink) now?

Covid 19

Yet another black swan took off from her nest!

History and societies do not crawl. They make jumps. They go from fracture to fracture, with a few vibrations in between. Yet we (and historians) like to believe in the predictable, small incremental progression.

The Black Swan – The Impact of the Highly Improbable, Nassim Nicholas Taleb

Simple time-frame comparative analysis

  1. Most thought we wont see (anytime soon) another global black swan since the last one only took off in 2008: the financial crises.
  2. Patterns and trends would have reassured us that it would take over two decades for humanity to ‘prepare’ the creation of another global malicious event. Here is one (quantitative) way of reasoning:
    • after experiencing 40 million loss of lives in WW1, it took humans 21 years, 2 months and 9 days to strike out WW2 which led to 60 millions casualties
    • it took a nominated chancellor 6 years, 8 months and 2 days to invade another European country (though turmoil began in mid 1930 with border events between Japan, the Soviet Union and Mongolia)

Leaders acted hastily following trends and interpreting miscellany of data in a quest for ubiquitous report between surfing the economy wave and lockdown.

(Some) politicians, statisticians, media analysts and any other citizens, including influencers, minimized the gravity by comparisons to other data showcasing that the % of deaths by flu, cancer, HIV, etc. is higher that of Covid 19.

Wasn’t and still isn’t it a lack of social responsibility notably on behalf of politicians not to frame the moral problems:

1. Who decides who lives and who dies once, at national level, intensive care units (the only possible protocol) have reached their maximum potential?

2. What is the norm when medical triage is no longer possible since doctors confront nothing but life strengthening situations?

Rating: 1 out of 5.

Rate us